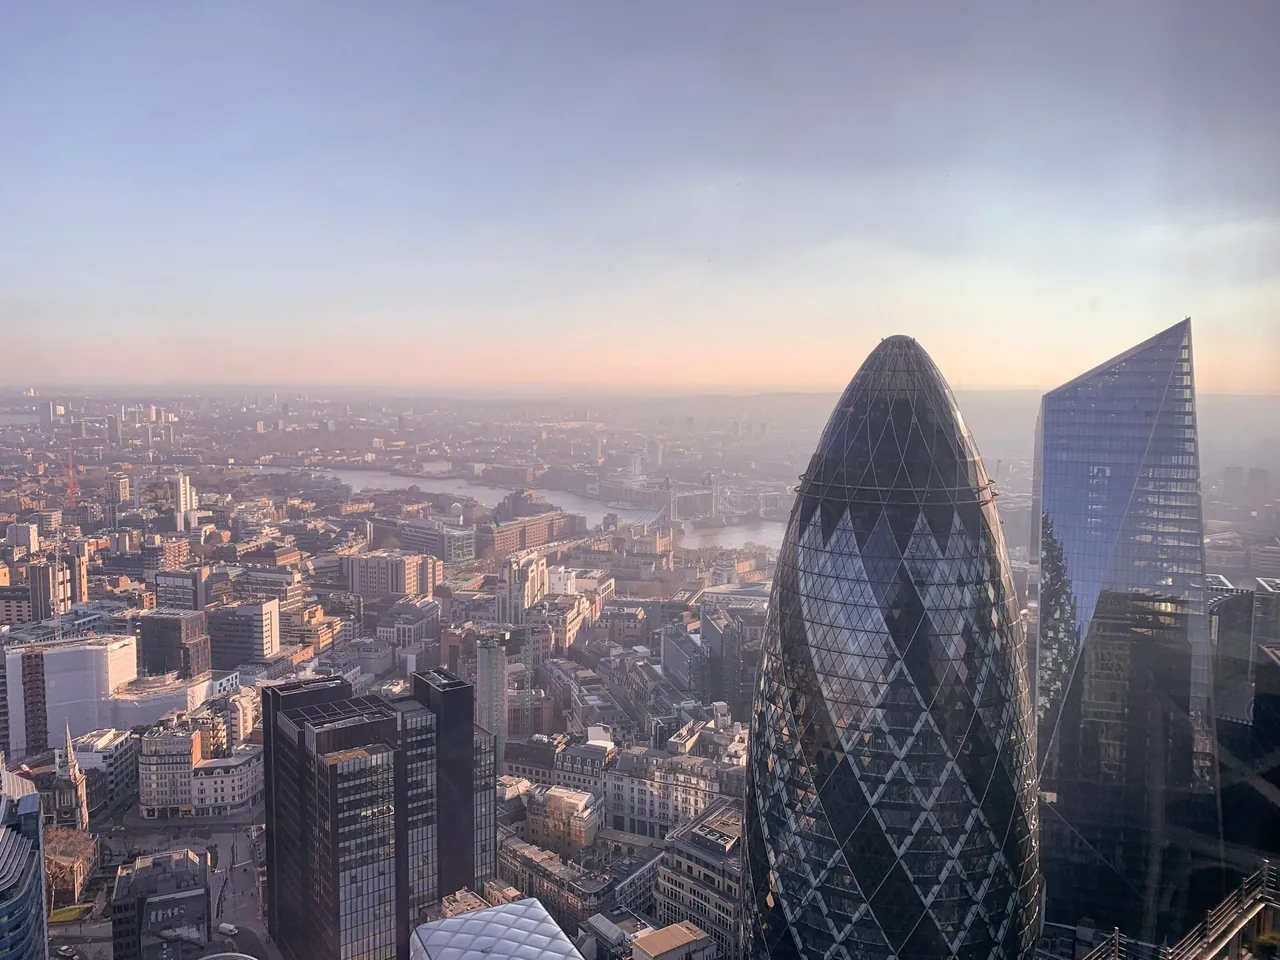
London skyline and the River Thames

EUROPE UNITED KINGDOM

London.
Find your place.

Explore homes by location and price. Get to know your next neighbourhood and see the full property details with the original agent.

33 areas to discoverDirect to the agents
London, United Kingdom
What feels like home?Choose your area, property and budget.
Reset
Features, energy & total costs

Yes / No require explicit information. Select “Unknown” to find missing or conflicting details.

Unresolved totals cannot match a subtotal budget. One-off payments are separate for rent and included for a purchase when explicitly additional. Deposit and optional costs stay separate. Place-level price-per-m² statistics still use advertised prices.

Location, daily life & surroundings

Only current supported values match a filter. Climate and area data come from place profiles; walking times and chargers relate to the supplied property location.

Icons show supported details. A missing icon means unknown, not no. Open questions and data coverage are available under “Costs, strengths & open questions” for each listing.

LondonTower Hamlets
Coverage is growing

Tower Hamlets

Choose a borough and discover its properties.

FOR SALE · FLAT
London · Borough mapYou can also select an area from the list below.
Median £/m²
LowerHigher
Fewer than 10 listings with floor area

Asking prices from connected sources · partial market coverage. Methodology

No verified listings available yet

There are no current listings from our connected sources for this selection. Try a different borough or adjust your filters.

Sort areas by median price per m², name or listing count. Areas without enough comparable prices appear last.

YOUR CITY, YOUR NEIGHBOURHOOD

Which borough feels like home?

Compare listings and asking prices by area
SSouthwark22 listings—Price data 5 / 10
  • PV model per kWp / year 1025 kWh/kWp

LLambeth8 listings—Price data 0 / 10
  • PV model per kWp / year 1022 kWh/kWp

CLCity of London4 listings—Price data 0 / 10
  • PV model per kWp / year 1020 kWh/kWp

GGreenwich1 listings—Price data 1 / 10
  • PV model per kWp / year 1037 kWh/kWp

BDBarking and DagenhamNo listings yet—Price data 0 / 10
  • PV model per kWp / year 1046 kWh/kWp

BBarnetNo listings yet—Price data 0 / 10
  • PV model per kWp / year 1016 kWh/kWp

BBexleyNo listings yet—Price data 0 / 10
  • PV model per kWp / year 1049 kWh/kWp

BBrentNo listings yet—Price data 0 / 10
  • PV model per kWp / year 1022 kWh/kWp

BBromleyNo listings yet—Price data 0 / 10
  • PV model per kWp / year 1043 kWh/kWp

CCamdenNo listings yet—Price data 0 / 10
  • PV model per kWp / year 1021 kWh/kWp

CCroydonNo listings yet—Price data 0 / 10
  • PV model per kWp / year 1023 kWh/kWp

EEalingNo listings yet—Price data 0 / 10
  • PV model per kWp / year 1023 kWh/kWp

EEnfieldNo listings yet—Price data 0 / 10
  • PV model per kWp / year 1022 kWh/kWp

HHackneyNo listings yet—Price data 0 / 10
  • PV model per kWp / year 1024 kWh/kWp

HFHammersmith and FulhamNo listings yet—Price data 0 / 10
  • PV model per kWp / year 1027 kWh/kWp

HHaringeyNo listings yet—Price data 0 / 10
  • PV model per kWp / year 1020 kWh/kWp

HHarrowNo listings yet—Price data 0 / 10
  • PV model per kWp / year 1023 kWh/kWp

HHaveringNo listings yet—Price data 0 / 10
  • PV model per kWp / year 1061 kWh/kWp

HHillingdonNo listings yet—Price data 0 / 10
  • PV model per kWp / year 1028 kWh/kWp

HHounslowNo listings yet—Price data 0 / 10
  • PV model per kWp / year 1027 kWh/kWp

IIslingtonNo listings yet—Price data 0 / 10
  • PV model per kWp / year 1019 kWh/kWp

KCKensington and ChelseaNo listings yet—Price data 0 / 10
  • PV model per kWp / year 1021 kWh/kWp

KTKingston upon ThamesNo listings yet—Price data 0 / 10
  • PV model per kWp / year 1029 kWh/kWp

LLewishamNo listings yet—Price data 0 / 10
  • PV model per kWp / year 1025 kWh/kWp

MMertonNo listings yet—Price data 0 / 10
  • PV model per kWp / year 1028 kWh/kWp

NNewhamNo listings yet—Price data 0 / 10
  • PV model per kWp / year 1036 kWh/kWp

RRedbridgeNo listings yet—Price data 0 / 10
  • PV model per kWp / year 1043 kWh/kWp

RTRichmond upon ThamesNo listings yet—Price data 0 / 10
  • PV model per kWp / year 1030 kWh/kWp

SSuttonNo listings yet—Price data 0 / 10
  • PV model per kWp / year 1026 kWh/kWp

THTower HamletsNo listings yet—Price data 0 / 10
  • PV model per kWp / year 1023 kWh/kWp

WFWaltham ForestNo listings yet—Price data 0 / 10
  • PV model per kWp / year 1024 kWh/kWp

WWandsworthNo listings yet—Price data 0 / 10
  • PV model per kWp / year 1023 kWh/kWp

WWestminsterNo listings yet—Price data 0 / 10
  • PV model per kWp / year 1021 kWh/kWp

London to explore. A clearer picture.

From riverside neighbourhoods to village-like high streets, London offers many ways to feel at home. Explore its 32 boroughs and the City of London, compare the asking prices we cover and visit each agent for the complete property details. Our figures describe connected sources, not the whole London market.

Figures describe current listings from our connected sources. Agent counts can overlap where the same property is listed by more than one agent. How our statistics work.

London · Photo: Alev Takil · Unsplash License · Source and credits

Climate, internet & surroundings

Sources, precision & freshness

PVGIS / European Commission JRC · available

district reference point / regional model · 2026-10-18 → 2027-10-18 · PVGIS usage conditions
  • Solar model: 1 kWp, south-facing, 35° tilt, 14% losses. Roof, building shade and permission have not been assessed.

Summer index = max(0, 100 − hot days × 2.5). Walk index = max(0, 100 − walking minutes × 100/30). Internet index = min(100, Mbit/s / 10). These are comparison scales, not guarantees of living quality. Climate is regional; a reference-point internet value does not describe every connection in an area.