
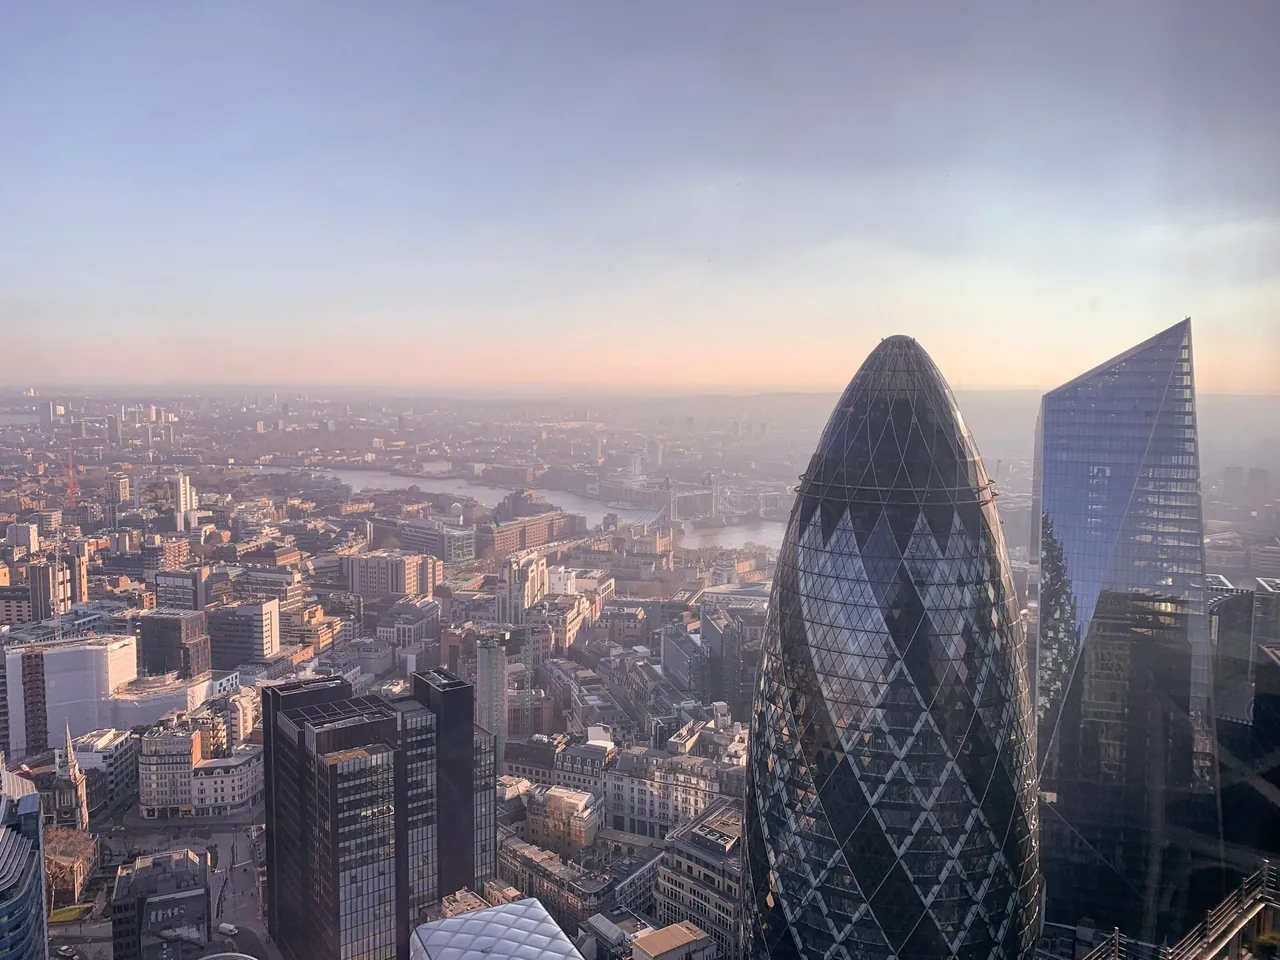
London.
Find your place.
Explore homes by location and price. Get to know your next neighbourhood and see the full property details with the original agent.
Wandsworth
Choose a borough and discover its properties.
Asking prices from connected sources · partial market coverage. Methodology
No verified listings available yet
There are no current listings from our connected sources for this selection. Try a different borough or adjust your filters.
Sort areas by median price per m², name or listing count. Areas without enough comparable prices appear last.
YOUR CITY, YOUR NEIGHBOURHOOD
Which borough feels like home?
- PV model per kWp / year 1025 kWh/kWp
- PV model per kWp / year 1022 kWh/kWp
- PV model per kWp / year 1020 kWh/kWp
- PV model per kWp / year 1037 kWh/kWp
- PV model per kWp / year 1046 kWh/kWp
- PV model per kWp / year 1016 kWh/kWp
- PV model per kWp / year 1049 kWh/kWp
- PV model per kWp / year 1022 kWh/kWp
- PV model per kWp / year 1043 kWh/kWp
- PV model per kWp / year 1021 kWh/kWp
- PV model per kWp / year 1023 kWh/kWp
- PV model per kWp / year 1023 kWh/kWp
- PV model per kWp / year 1022 kWh/kWp
- PV model per kWp / year 1024 kWh/kWp
- PV model per kWp / year 1027 kWh/kWp
- PV model per kWp / year 1020 kWh/kWp
- PV model per kWp / year 1023 kWh/kWp
- PV model per kWp / year 1061 kWh/kWp
- PV model per kWp / year 1028 kWh/kWp
- PV model per kWp / year 1027 kWh/kWp
- PV model per kWp / year 1019 kWh/kWp
- PV model per kWp / year 1021 kWh/kWp
- PV model per kWp / year 1029 kWh/kWp
- PV model per kWp / year 1025 kWh/kWp
- PV model per kWp / year 1028 kWh/kWp
- PV model per kWp / year 1036 kWh/kWp
- PV model per kWp / year 1043 kWh/kWp
- PV model per kWp / year 1030 kWh/kWp
- PV model per kWp / year 1026 kWh/kWp
- PV model per kWp / year 1023 kWh/kWp
- PV model per kWp / year 1024 kWh/kWp
- PV model per kWp / year 1023 kWh/kWp
- PV model per kWp / year 1021 kWh/kWp
London to explore. A clearer picture.
From riverside neighbourhoods to village-like high streets, London offers many ways to feel at home. Explore its 32 boroughs and the City of London, compare the asking prices we cover and visit each agent for the complete property details. Our figures describe connected sources, not the whole London market.
Figures describe current listings from our connected sources. Agent counts can overlap where the same property is listed by more than one agent. How our statistics work.
London · Photo: Alev Takil · Unsplash License · Source and credits